Here are some numbers to help frame this conversation:
551,000 – residential sales over all Canadian MLS® Systems in 2020—a new annual record.
Think that’s a lot? It’s really not. When you adjust home sales to account for population growth, we’re still below 2005, 2006, 2007 (by a lot) and 2016.
But activity is on the rise. Here are the numbers to think about as we begin 2021:
714,500 – December 2020 sales activity on a seasonally adjusted at annual rates (SAAR) basis.
December was another all-time monthly sales record. Just as a thought exercise, if monthly sales activity were to stay where it was in December right through 2021, we’d have more than 700,000 sales in 2021. Compare that to the 2020 record of about 550,000! To be clear, we aren’t expecting 700,000 sales in 2021. The point I want to make here is things could really cool off from where they are currently and 2021 would still be another record year. It shouldn’t be all that hard to beat “the year with no spring market.” The challenge we have in 2021 may be “the year with not enough homes for sale.”
99,265 – the number of active listings on all Canadian MLS® Systems as we were all singing Auld Lang Syne (distantly) on January 1. Want to know when the last time this number was under 100,000? Unfortunately, our database for active listings only goes back three decades so I can’t say. Given population and housing stock growth over all that time, the fact we currently have the lowest level of active supply on record is a big deal. Five years ago, it was 250,000.
OK, so that’s record setting sales (right now) and record low supply (right now). Put them together and you get one of our favourite stats, the number of months of inventory. As of New Year’s Day, there were 2.1 months of inventory for all of Canada. The longer-term normal or balanced level for this metric is 5.2 months. But how does that compare with history? Well, we had a housing boom in the early 2000s—prices basically doubled from about 2002 to 2007. Months of inventory then were a little under four. Then, following the financial crisis for much of the 2010s things were sort of boring, with months of inventory a little over six. That’s how you get an average of five. Right now, it’s two!
What does it all mean? Well, the stat to watch in 2021 will be new listings, particularly in the spring. How many existing owners will put their homes up for sale?
Even though sales are already setting records, we know demand is much stronger than those sales numbers suggest because we see it overflowing increasingly on the price side. A listing with 10 offers still only results in one sale but a whole bunch of upward price movement. That’s not a prediction. It’s already happening.
How the current situation plays out in the sales and price data will depend on how many homes become available to buy in the months ahead. Our experience suggests that we might see a bit of a head-fake slowdown in sales to start 2021. Don’t be fooled. With markets as tight as they are, there is less carry-over of existing supply into the New Year, so things tend to quiet down in January and February as we wait for the new spring listings. It’s hard to know how many of those there will be, and how many buyers are out there waiting to pounce, but I’ll go on record saying it will probably be headline-grabbing however it plays out.
As a final thought, ideally, we’d like for households to be able to find and acquire the homes that best suit their needs, for people to be able to move around when they want to, and for housing to remain affordable. But the fact is, we’re facing a major supply problem in 2021.
Join us for our next Instagram Live, scheduled to take place Monday, Feb. 1 on CREA’s Instagram page, where I will answer your questions and take part in a candid and casual conversation about some of the country’s more interesting markets. Make sure to send your questions to crea-comms@crea.ca or by checking our social media accounts.
Share these infographics on social media
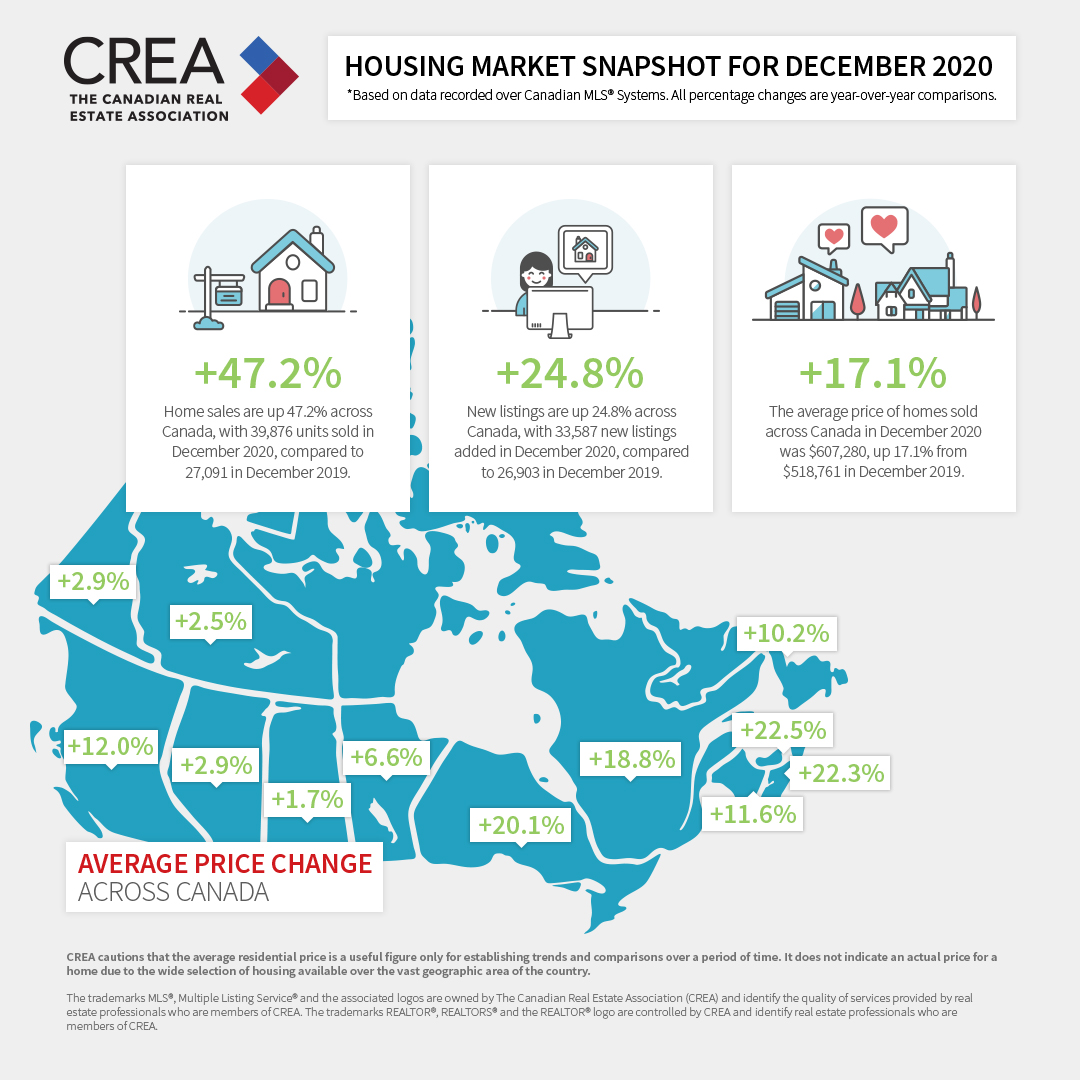
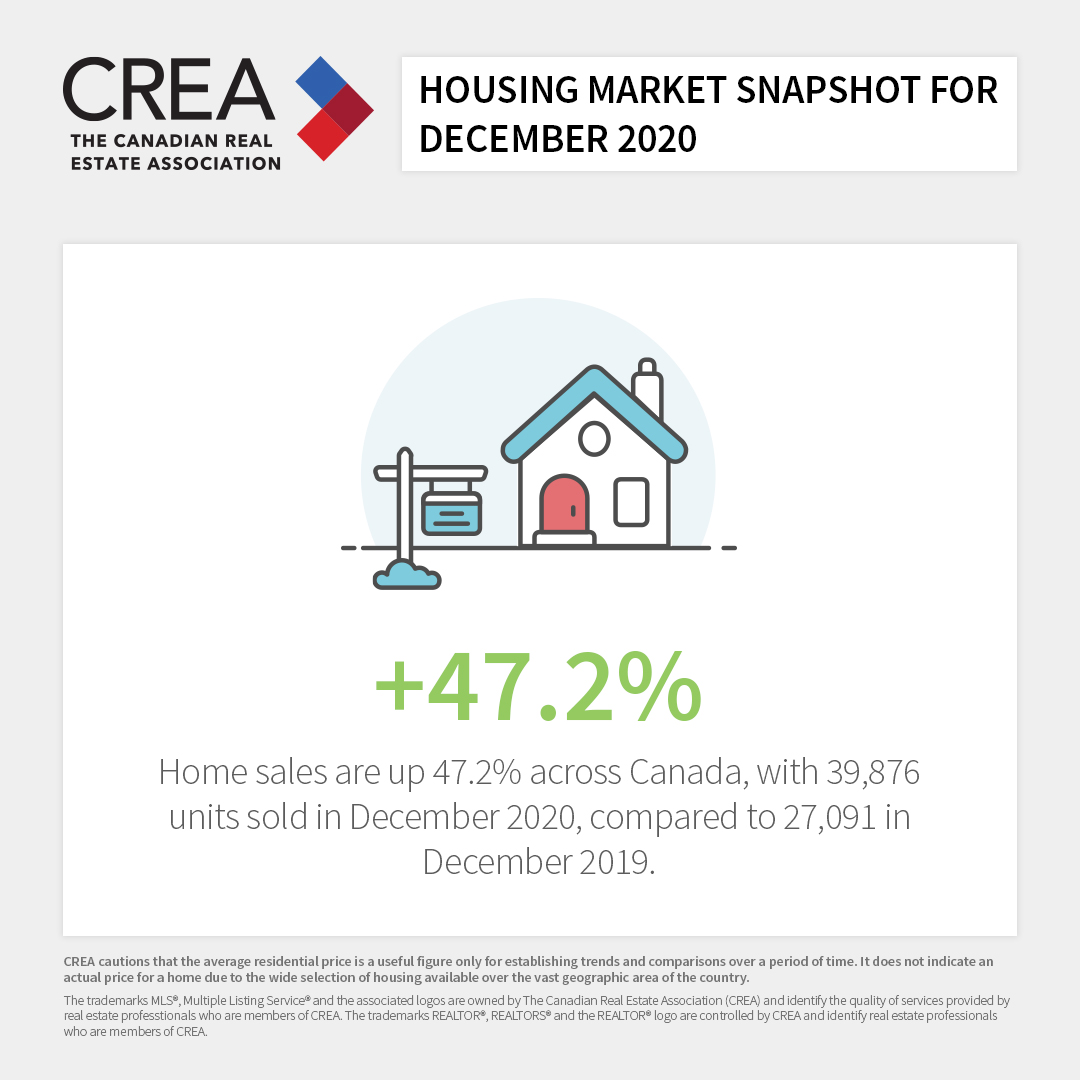
Hover over the image to share on your social media pages.
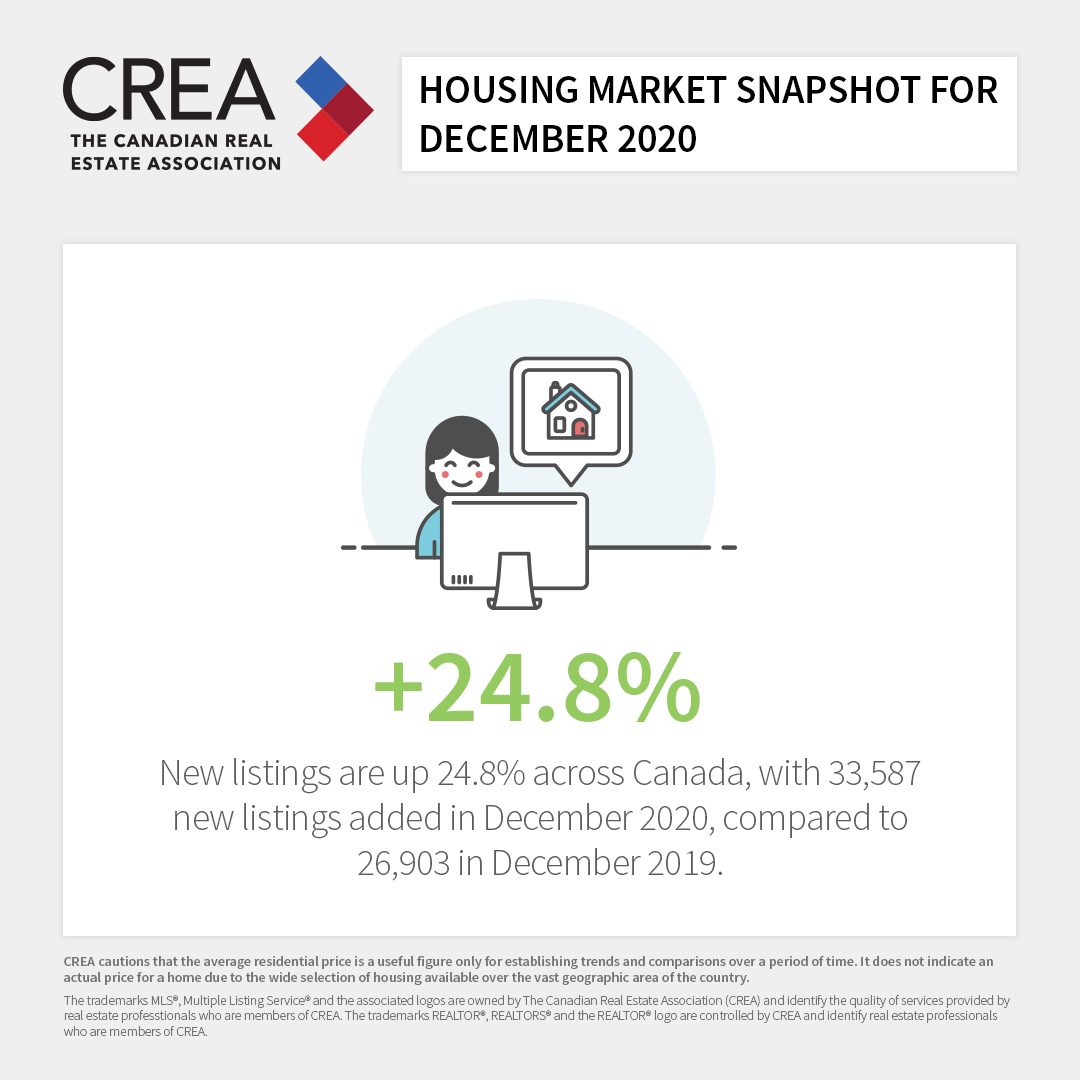
Hover over the image to share on your social media pages.
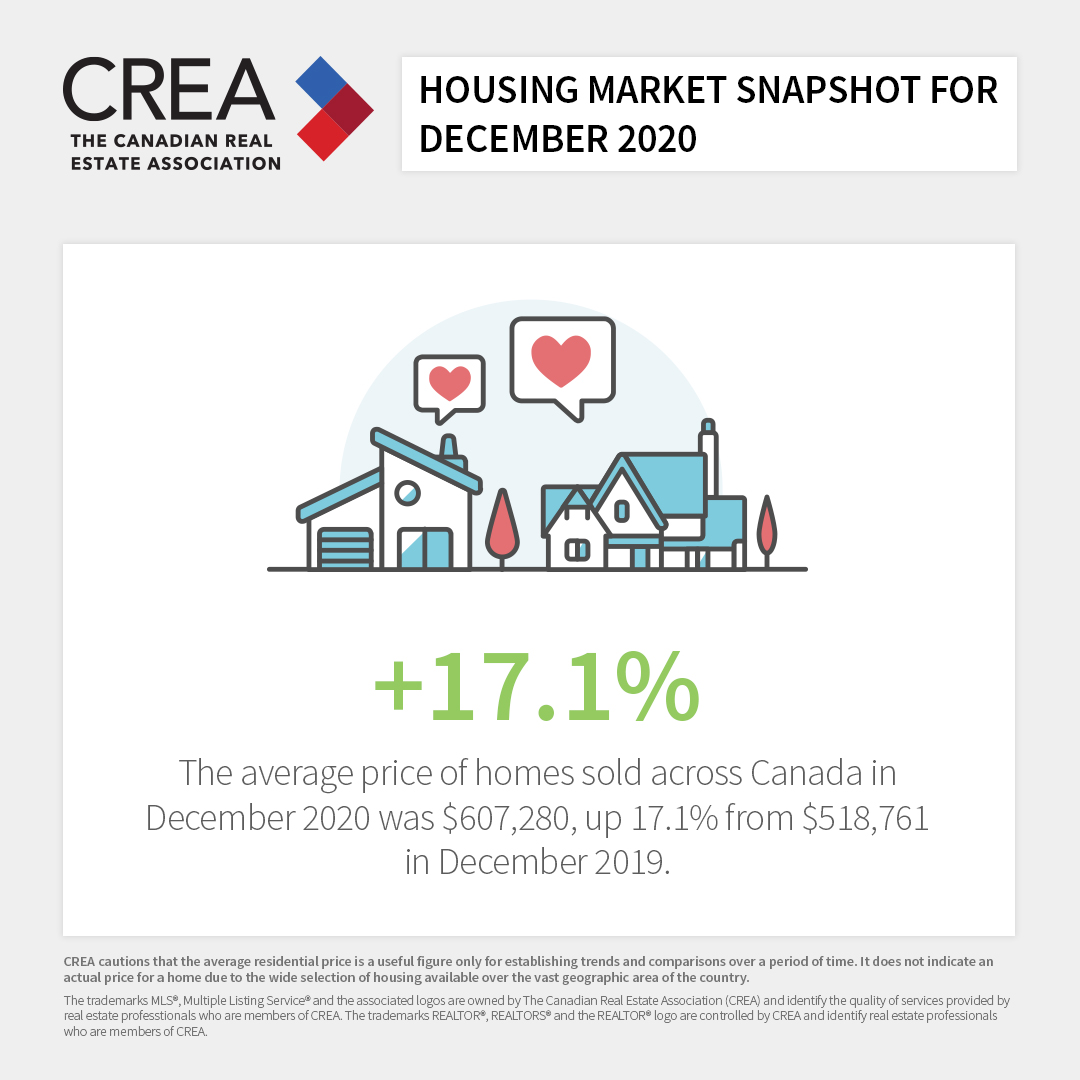
Hover over the image to share on your social media pages.